9 Molecular networks
This is a chapter about molecular networks
9.1 MetGem
The documentation for MetGem can be found here:
Metgem webpage: https://metgem.github.io/
Metgem handbook: https://metgem.readthedocs.io/en/latest/index.html
Main steps for the dataset is to generate a combined msp or mgf file (such as from MS-DIAL or xcms) and import it to MetGem. Additional metadata should also be added to relate the ID of different compounds or unknowns.
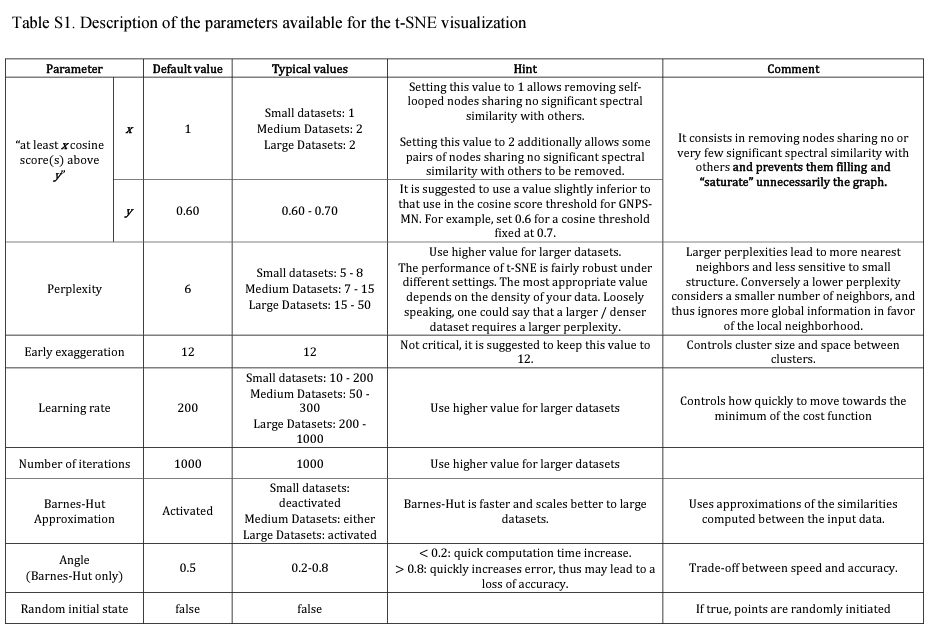
9.1.1 Metgem parameters
LC https://pubs.acs.org/doi/10.1021/acs.analchem.8b03099 MS2 spectra were window-filtered by choosing only the top six peaks in the ±50 Da window throughout the spectrum. The data were filtered by removing all peaks in the ±17 Da range around the precursor m/z. The m/z tolerance windows used to find the matching peaks was set to 0.01 Da, and cosine scores were kept under consideration for spectra sharing three matching peaks at least. The molecular network was created where edges were filtered to have a cosine score of >0.7. Further edges between two nodes were kept in the network if and only if each of the nodes appeared in each other’s respective top 10 most similar nodes. With regard to the t-SNE output, nodes were kept under consideration only if they share at least one cosine score above 0.6 with others (“at least one cosine score above 0.6” parameter). The number of iterations, perplexity, learning rate, and early exaggeration parameters were set to 1000, 6, 200, and 12, respectively. The Barnes-Hut approximation was activated using a θ angle of 0.5°. These values were initially used as a first approximation based on the scikit-learn t-SNE package default parameters. Except for the perplexity that has been reduced from 30 to 6, which was more adapted for small data sets, all these parameters looked appropriate as very well-defined clusters were clearly perceptible and the data organization was consistent with the observed fragmentation patterns.
Group mapping files can be used in MetGem to create groups within sample datasets depending on any observation or user’s specification (biological activity, origin of a sample, taxonomy, analytical details or whatever). These groups can further be mapped in both MNs and t-SNE graphs to ease the visualization and the analysis of data. Group mapping files must be submitted as .txt files and follow the GNPS-style format: GROUP_Active=Sample1.mzXML;Sample2.mzXML GROUP_Inactive=Sample3.mzXML;Sample4.mzXML GROUP_Blanks=Blank1.mzXML GROUP_Samples=Sample1.mzXML;Sample2.mzXML;Sample3.mzXML;Sample4.mzXML GROUP_Active signifies that this group contains the two samples 1 and 2, MetGem will then sum up the peak area values of these two samples for each feature and display the result in a new dedicated “Active” column in the metadata table. Note that a sample can be assigned to several groups and at least one sample must appear in a specified group.
Small datasets: up to 2 000 nodes
Medium Datasets: 2 000 to 10 000 nodes
Large Datasets: > 10 000 nodes
For more information, please see : https://lvdmaaten.github.io/tsne/ ; http://scikit-learn.org/stable/modules/manifold.html#t-sne.
GC data
- From MSDIAL: Export “Alignment result”. check “Raw data matrix (Area)” and “Representative spectra”. Check “Filter by..blank samples”. Export format “msp”.
- Copy the .txt file to excel. Copy the content to a new sheet. Remove top rows, select only: “Alignment ID”, “Metabolite name”, “Average Rt(min),”Quant mass”, and the areas of selected samples. Save sheet as tab delimited file (.txt). The number of rows should be the same as the number of individual queries in the msp file.
NOTE: For GC orbitrap data: - When importing metadata, have the “index column” empty, instead of Alignment ID. Otherwise ID will be incorrectly assigned. - check the treat as MS1 data
- m/z tolerance: 0.01 Da
- Minimum matched peaks: 6
- uncheck the “Keep peaks outside of the…” box
- uncheck the “Keep each peak in top…” or use a low setting such as “top 10 in the 5 Th window”
- Check the “Keep peaks above 1% of maximum”
Can play around with the “% peak of maxmum” and “top n” parameters to get best parameters for your purpose. Use annotated compounds or a standards msp library to check related compounds and/or metabolites and parents.
Network parameters: cosine score: 0.65
t-sne parameters: cosine score: 0.6
Text from authors GC method: A new option was added to the input data file dialogue. When this option is activated, input spectra are treated as MS1, and thus, the parent m/z ratio is fully ignored.
The molecular networks were created using MetGem 1.2.2 software (https://metgem.github.io/). EI-MS spectra were window filtered by choosing only the top 6 peaks in the ±50 Da window throughout the spectrum. Cosine scores were calculated using a m/z tolerance of 0.3 Th. Networks were then created where edges were filtered to have a cosine score above 0.7 (or 0.75 in the case of GC-EI-MS data from perfumes) and more than six matched peaks. Furthermore, edges between two nodes were kept in the network if and only if each of the nodes appeared in each other’s respective top 10 most similar nodes. The library spectra were filtered in the same manner as the input data.
9.2 GNPS
https://gnps.ucsd.edu/
https://ccms-ucsd.github.io/GNPSDocumentation/fileupload/
Carbon marker table: https://ccms-ucsd.github.io/GNPSDocumentation/gc-ms-library-molecular-network/