10 Spectral libraries
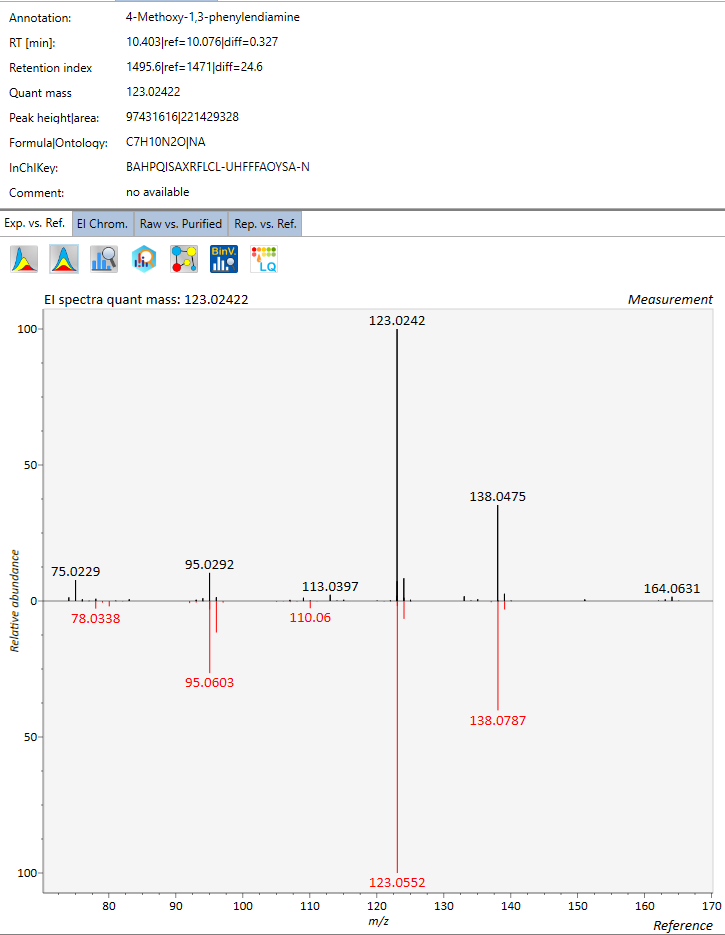
In environmental analysis, NIST MS library is widely used to match a spectrum to a list of standard spectra. However, a major drawback of the NIST MS Search is that now all chemicals are included and all spectral ions are at unit mass (for EI spectra library, also called mainlib)
Below figure shows a relatively good spectral match for a standard if only nominal or even at 0.1 decimal m/z:
10.1 MatchMS
https://matchms.readthedocs.io/en/latest/
10.2 IN SILICO FRAGMENTATION
There are several openly available models that have recently been published to predict the fragmentation patterns of GC-EI MS.
10.2.1 Metfrag
10.2.2 Sirius CSI FingerID
- Need to convert msp to mgf format
- If generating mgf file, then it needs to be saved as UTF-8 (UTF-8 with BOM doesnt work with Sirius)
- For GC data:
BEGIN IONS
PEPMASS=
NAME=
MOLECULARFORMULA=
CHARGE=1
ADDUCT=[M]+
MSLEVEL=2
mz “tab” intensity
END IONS
where the “tab” is tab key between the mz and intensity value pair
when using MSLEVEL=2, then isotopes of precursor ion will not be matched. IF needed then
10.2.3 CFM-ID
In silico fragmentation:
Help file: https://sourceforge.net/p/cfm-id/wiki/Home/
Use instructions:
- If you are using EI-MS (GC-MS) data, please use the ei_ms_model provided.
- Note that lpsolve55.dll must also be included in the same directory as the executables. This file can be found in the development version of LPSolve (e.g. lp_solve_5.5.2.0_dev_win32.zip), which can be downloaded from https://sourceforge.net/projects/lpsolve/files/lpsolve/5.5.2.5/lp_solve_5.5.2.5_dev_win32.zip/download.
Cfm-predict
COMMAND:
cfm-predict.exe <smiles_or_inchi_or_file> <prob_thresh> <param_file> <config_file> <annotate_fragments> <output_file_or_dir> <apply_postproc> <suppress_exceptions>
EXAMPLE (naphthalene):
cfm-predict.exe InChI=1S/C10H8/c1-2-6-10-8-4-3-7-9(10)5-1/h1-8H 0.001 D:/Program/cfm-id-2.4_win32/ei_nn_iso_new/param_output.log D:/Program/cfm-id-2.4_win32/ei_nn_iso_new/param_config.txt 0 D:/Program/cfm-id-2.4_win32/test/output.msp
EXAMPLE (.txt file as input):
cfm-predict.exe D:/Program/cfm-id-2.4_win32/test/input.txt 0.001 D:/Program/cfm-id-2.4_win32/ei_nn_iso_new/param_output.log D:/Program/cfm-id-2.4_win32/ei_nn_iso_new/param_config.txt 0 D:/Program/cfm-id-2.4_win32/test/output.msp
10.3 NEIMS
Help files: https://github.com/brain-research/deep-molecular-massspec
10.4 DeepEI
Help files: https://github.com/hcji/DeepEI
https://github.com/hcji/DeepEI/blob/master/Usage.ipynb
10.5 QCxMS
This program only runs on LINUX SERVER.
- Check QCxMS online manual for details
- Check PlotMS online manual
PREPARATION - Download the latest version of QCxMS at: https://github.com/qcxms/QCxMS/releases/
- Download the lates PlotMS version at: https://github.com/qcxms/PlotMS/releases/ and copy to the same folder as QCxMS
- Copy the .XTBPARAM folder and the .mass_raw.agr files to /home/ORUNET.ORU.SE/twg/
- Prepare a file with the equilibrium structure of your desired molecule. Important: This file has to be named
coord(without file extension) and should have the TURBOMOLE coord format (tmol).
1.1. Simple: download the 3D conformer structure in pubchem in sdf format and then convert using openbabel -> tmol. Remove the file extension .tmol so the file name is only coord without any extension
1.2. Optimized 3D conformer according to steps by Wang et al:
- Download the 3D conformer in Pubchem as sdf. - Import into Avogadro (https://avogadro.cc/). If 3d-struture is not available, then use “build”-> “insert SMILES”. This will take longer time to optimize.
- Use the auto-optimize tool (https://avogadro.cc/docs/tools/auto-optimize-tool/); Force field (MMFF94), Steps per update (10), Steepest Descent. When dE=0 then it is optimized and you can save as a .mol file.
- Use Openbabel to convert .mol to .tmol file. Rename as coord without the extension.
- Prepare an input file called “qceims.in”. For the input options, see the online manual or the qceims.in file in the examples folder. If no such file is prepared, default options are: run GFN1-xTB with 25 times the number of atoms in the molecule trajectories (ntraj).
TO RUN QCEIMS
Open bash
- Enable overwriting files in your Linux:
set +o noclobber- Place the executables into your $HOME/bin directory or path. Easiest is to enable the QCxMS executables in the path as seen below (replace the names if the QCxMS executables are in another folder):
Check: https://linuxize.com/post/how-to-add-directory-to-path-in-linux/
echo $PATH

export PATH=/home/ORUNET.ORU.SE/twg/QCxMS/:/home/ORUNET.ORU.SE/twg/bin:/home/ORUNET.ORU.SE/twg/.local/bin:/bin:/usr/bin:/opt/thinlinc/bin:/usr/local/bin:/usr/bin/X11:/sbin:/usr/sbin:/usr/local/sbin:/snap/bin:/opt/thinlinc/bin:/opt/SPAdes/SPAdes-3.13.0-Linux/bin:/opt/mauve/mauve_snapshot_2015-02-13:/opt/parsnp/Parsnp-Linux64-v1.2:/opt/prokka/prokka-master/bin:/opt/artemis/artemis- go to your folder, e.g:
cd QCxMS/example/ethanolRun:
qcxmsRun qcxms again and check the ouput if all is ok.
- Executing production runs. If you want to run QCxMS locally, use the pqcxms script with -j number of parallel jobs and -t number of OMP threads:
pqcxms -j <integer> -t <integer> &

e.g: pqcxms -j 6 -t 4  &
Make sure you add the &at the end so you can return to the prompt by hitting Enter.
You can check how any CPUs and threads are used by opening a new console and type top and then press 1 followed by t for visual bar chart.
Check the status of your QCxMS run by changing to your working directory (first press Enter to get back the prompt) and typing
getres, which will provide an output of the form:
XXX runs done and written to tmpqceims.res/out
which gathers the runs already finished (creates tmpqceims.res and tmpqceims.out). The final results are on qceims.out and qceims.res
SKIP: this doesnt work anymore with the new QCxMS version 6. (Download an exp. EI-MS from the NIST if available and copy it to the working dir as exp.dat; take the JCAMP-DX format from their web page).
get spectrum by
plotmsSKIP: and plot it with xmgrace mass.agr. the file “.mass.agr” should be in your home dir. plotms reads by default <qceims.res> or by plotms -f <name_of_res_file> any other res file. Check the consistency of the total charge.
- Clean the csv file to remove low abundance ions and then copy the m/z and rel abundance to an msp file. Run
MS-LIMAto compare the spectra.
ADDITIONAL_OPTIMIZATION: if the ratio of fragment to M+ signals is too large decrease the IEE by increasing the parameter ieeatm (default is 0.6 eV/atom) by inserting
ieeatm <value>in the qceims.in file and do the parallel run again (requires an additional qcxms pre-run).
- if the IEE is ok, increase ntraj to get better statistics and re-run (note: qcxms.res is appended so delete it at this point).
VERY IMPORTANT: EVERY CHANGE IN THE INPUT REQUIRES A RUN OF QCEIMS IN THE WORKING DIR BEFORE THE PARALLEL SCRIPT IS STARTED IN ORDER TO BE IN EFFECT!
trajectories are in TMPQCEIMS/TMP.
they are numbered by the run and the ion tracking number. (something like gmolden TMPQCEIMS/TMP.$1/trj.$1.$2 gives trajectory $1, track $2) for more QCEIMS code options (model parameters) see manual
useful options for qceims:
-c : check IEE but do nothing (requires M trajectory) -p : normal production (fragmentation) mode. Possible in any existing TMPQCEIMS/TMP.$1 directory. -eonly : use the requested QC (as specified in qceims.in) and do a single-point energy -e0 : same as above, charge = 0 -e1 : same as above, charge = 1 -qcp
other important options in <qceims.in>:
ip-
Vizualize trajectories
Export VMDMovie folder to Path, go first to the folder with VMDMovie then enter:
export PATH=$PATH:$(pwd)Go to the working directory and enter:
msmovie X Yto load the trajectory TMPQCEIMS/TMP.X/trj.X.Y. For instance, msmovie 1 1 loads the first trajectory of the first folder. Some adjustments according to personal preferences for movie-making may have to be made in these scripts.
In silico photodegradation product generation
Use the US EPA CTS: Chemical Transformation Simulator to predict photodegradation products by the Generate Transformation Products Module.
- Enter the lookup structure.
- Select: User selected -> Direct Photolysis.
- Choose number of generations of transformation products.
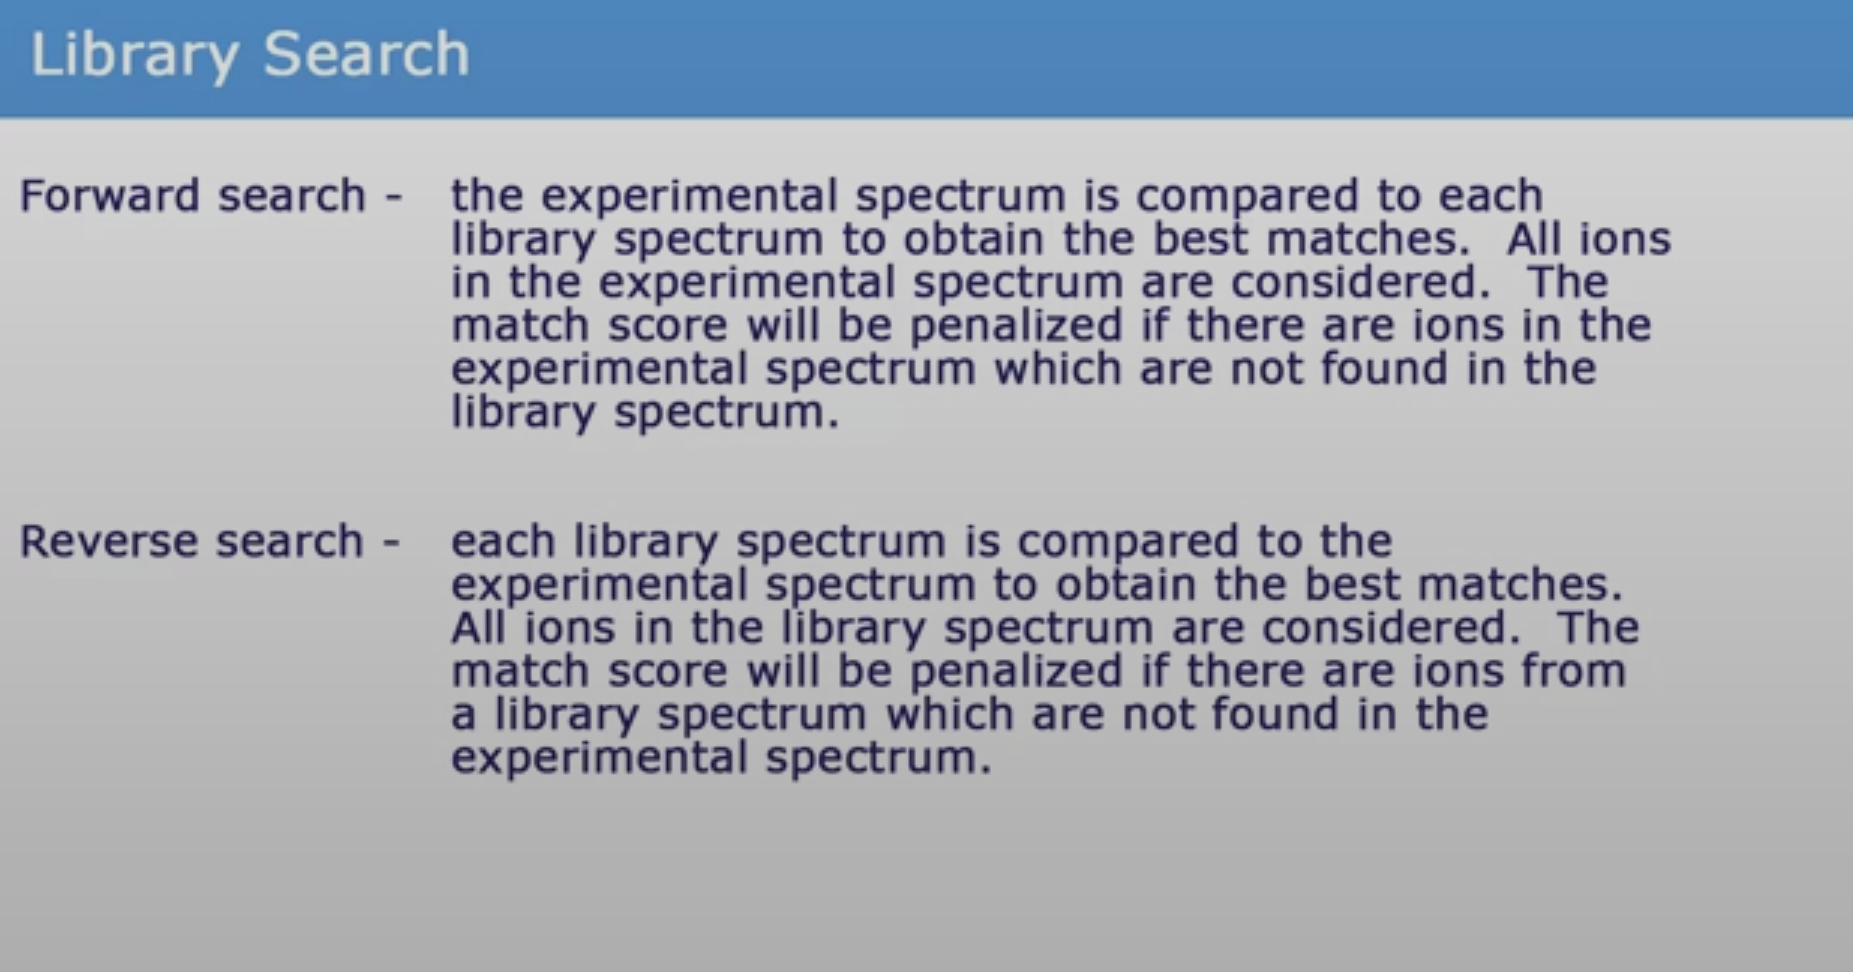
10.6 LIBRARY SEARCH
xx
10.7 Reading mgf files in R
10.8 LIB2NIST
Use LIB2NIST to convert combined msp file to NIST library. Convert your library list into NIST library format using LIB2NIST command line (in order to preserve the accurate mass since the GUI tool only convert to nominal mass) NOTE TO SELF: CHECK IF THIS IS TRUE. See command line help file for arguments.
NOTE TO SELF: NEED TO CHECK IF IT IS POSSIBLE TO INCLUDE Retention index. Check: https://www.nist.gov/system/files/documents/srd/NIST1aVer22Man.pdf (Section Import and Export of Retention indices with a spectrum)
Convert your library list into NIST library format using LIB2NIST command line (in order to preserve the accurate mass). See command line help file for arguments.
IN WINDOWS: open ‘cmd’, go to the folder where LIB2NIST is and type:
COMMAND:
lib2nist.exe /log9 Mylib.log /OutLib /StdRounding:N /MsmsOnly:Y /AccuratePeakMZ /PrecurMzDecPlaces=keep /PeakMzDecPlaces=keep /UseSubset:N <path to msp file> <output path> =<new name of library>
EXAMPLES:
lib2nist64.exe /log9 Mylib.log /OutLib /StdRounding:N /MsmsOnly:Y /AccuratePeakMZ /PrecurMzDecPlaces=keep /PeakMzDecPlaces=keep /UseSubset:N D:\Projects\Suspect_lists\Spectral_databases\RECETOX_GC-EI_MS_20201028.msp D:\Program\NIST14\ =RECETOX_GC-EI_MS_20201028
EXAMPLES:
lib2nist64.exe /log9 Mylib.log /OutLib /StdRounding:N /MsmsOnly:Y /AccuratePeakMZ /PrecurMzDecPlaces=keep /PeakMzDecPlaces=keep /UseSubset:N D:\Projects\Suspect_lists\Spectral_databases\2021-05-28_MTM_HRMS_RECETOX_THERMO.msp D:\Program\NIST14\ =MTM_HRMS_RECETOX_THERMO_20210528
10.9 MSPepSearch
Use MSPepSearch to query NIST msp output against NIST library and own library
EXAMPLES:
MSPepSearch64.exe Gusviqh /ZI 0.1 /ZIPPM 20 /MPPM 30 /MzLimits 50 -1 /MinMF 10 /OnlyFound /HITS 5 /LIB D:\Raw_data\Dust_Florian\GC\test\Mylib /INP D:\Raw_data\Dust_Florian\GC\test\input.msp /OUTMGF D:\Raw_data\Dust_Florian\GC\test\test.mgf /OUTTAB D:\Raw_data\Dust_Florian\GC\test\test.tsv /OutMW
MSPepSearch64.exe Gusviqh /ZI 0.1 /ZIPPM 20 /MPPM 30 /MzLimits 50 -1 /MinMF 100 /OnlyFound /HITS 5 /LIB D:\PROGRAM\NIST14\MTM_HRMS_RECETOX_THERMO_20220518 /INP D:\Projects\Mexico_Air\NIST_Mexico.msp /OUTMGF D:\Projects\Mexico_Air\test\test.mgf /OUTTAB D:\Projects\Mexico_Air\test\test.tsv
MSPepSearch64.exe Gusviqh /ZI 0.01 /ZIPPM 10 /MPPM 10 /MzLimits 50 -1 /MinMF 500 /OnlyFound /HITS 5 /LIB D:\PROGRAM\NIST14\MTM_HRMS /INP D:\Projects\Mexico_Air\NIST_Mexico.msp /OUTMGF D:\Projects\Mexico_Air\test\test.mgf /OUTTAB D:\Projects\Mexico_Air\test\test.tsv
MSPepSearch64.exe Gusviqh /ZI 0.01 /ZIPPM 10 /MPPM 10 /MzLimits 50 -1 /MinMF 500 /OnlyFound /HITS 10 /LIB D:\Program\NIST14\MTM_HRMS_RECETOX_THERMO_20220518 /INP D:\Raw_data\Dust_Florian\GC\Raw_data\mzML\Spectrum_0_202111221149_NIST.msp /OutChemForm /OUTMGF D:\TEST\MSPepsearch\test.mgf /OUTTAB D:\TEST\MSPepsearch\test.tsv
More info on commands on: https://pubs.acs.org/doi/suppl/10.1021/acs.analchem.9b03415/suppl_file/ac9b03415_si_001.pdf